mtr braille graph
Table of Contents
I often monitor network stability with mtr, which can show a time series
of how the network is doing at different hops between two endpoints. I recently
made an improvement to mtr that shows the time series as a graph using braille
characters.
braille #
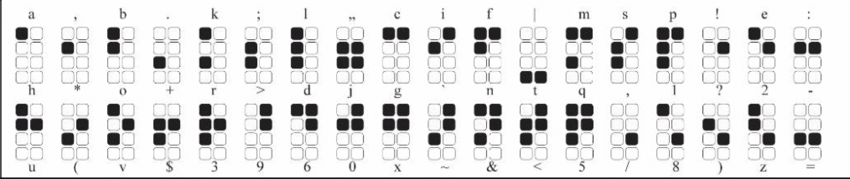
The Unicode character set has many glyphs, including many
block drawing characters.
Within those there are two types of braille pattern blocks: 6-dots and 8-dots,
the latter of which has a 4x2 matrix of dots ⣿, giving us 256 combinations of dots.
I had played with braille characters before in my blot plotting library. I had more leeway there, since the canvas was limited by the size of the terminal. This time I only have one line of text.
graphing #
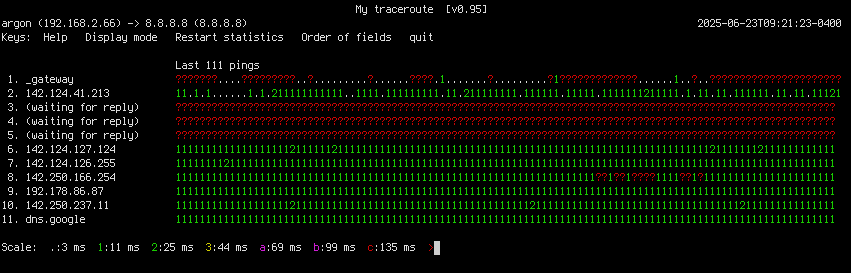
If you’re not familiar, mtr has multiple modes, including “display mode 2”, which
already displays a series of color codes alphanumeric characters to indicate the
round trip time to the hop along the routed being traced. It looks like this…
1❯ mtr -t 8.8.8.8 --displaymode=2
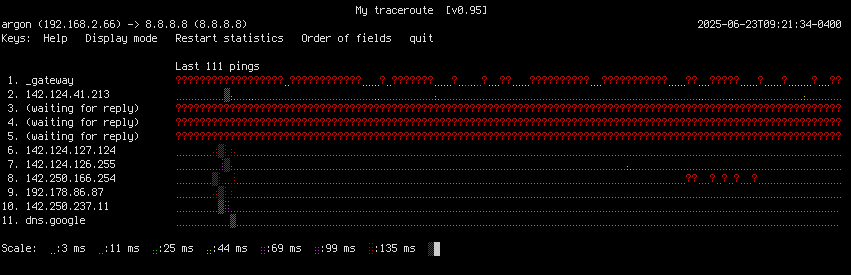
Adding braille characters has two major wins for mtr display:
- twice the history on the horizontal dimension
- can show relative latency in vertical dimension
1❯ mtr -t 8.8.8.8 --displaymode=3
running #
This change has been merged
(422f4a0)
into mtr, but I don’t think it’s part of any OS release. So you can build it yourself…
-
using docker
First, grab this Dockerfile, and optionally edit if.
Then from the directory containing the
Dockerfile, run…1❯ docker build -t mtr-build . 2❯ docker run -it mtr-build /mtr/mtr -t 8.8.8.8 --display=3 -
manual (Debian)
1❯ sudo apt update
2❯ sudo apt install git build-essential autoconf automake libncurses-dev libjansson-dev libcap-dev pkg-config locales
3❯ git clone
4❯ git clone https://github.com/traviscross/mtr.git /mtr
5❯ ./bootstrap.sh
6❯ ./configure
7❯ make
8❯ ./mtr -t 8.8.8.8 --display=3